№ 530310September 2026 · New York, NY
Alex's ResClub
Booking the hardest nYc reservations.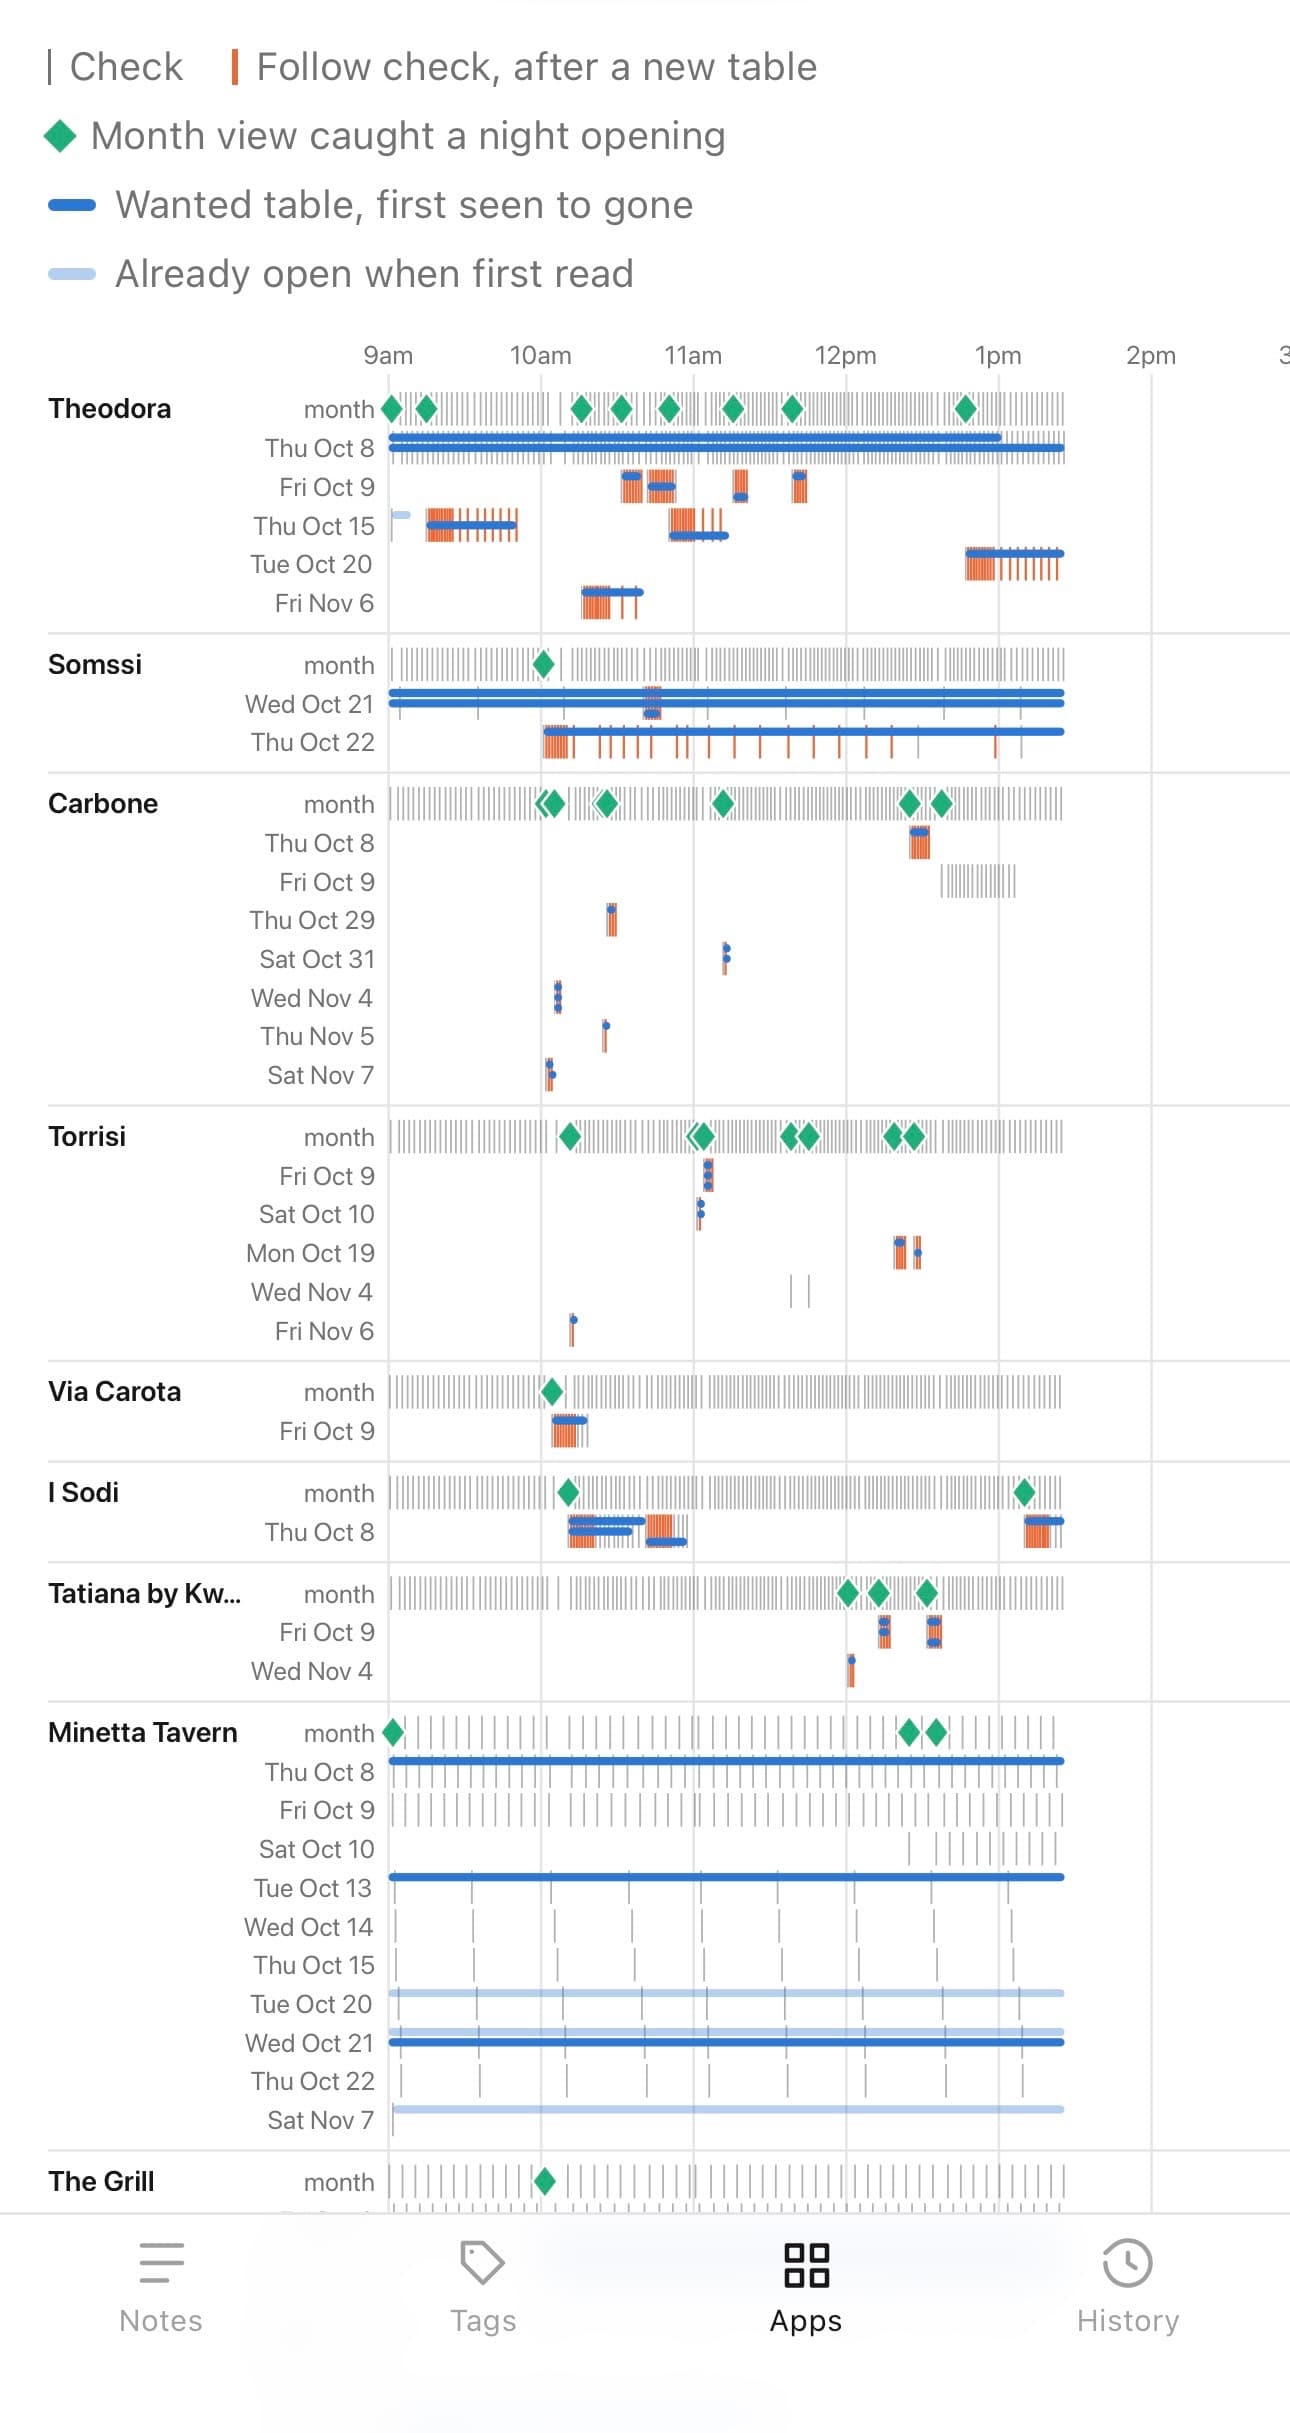
Problem
New York restaurants are notoriously hard to get. Tables do open up when people cancel, but they are gone in minutes.
Solution
Alex's ResClub watches the restaurants I care about and texts me the moment a dinner table appears, with a link to book it. It reads the same public calendar anyone can see, never signs in, and never books. I book by hand. A small portal lets me pick which places it watches and tell it the nights I am hoping for.
The key numbers: Arrival Rate and Lifetime
How often does a table appear at a place? and how long does it stay available?
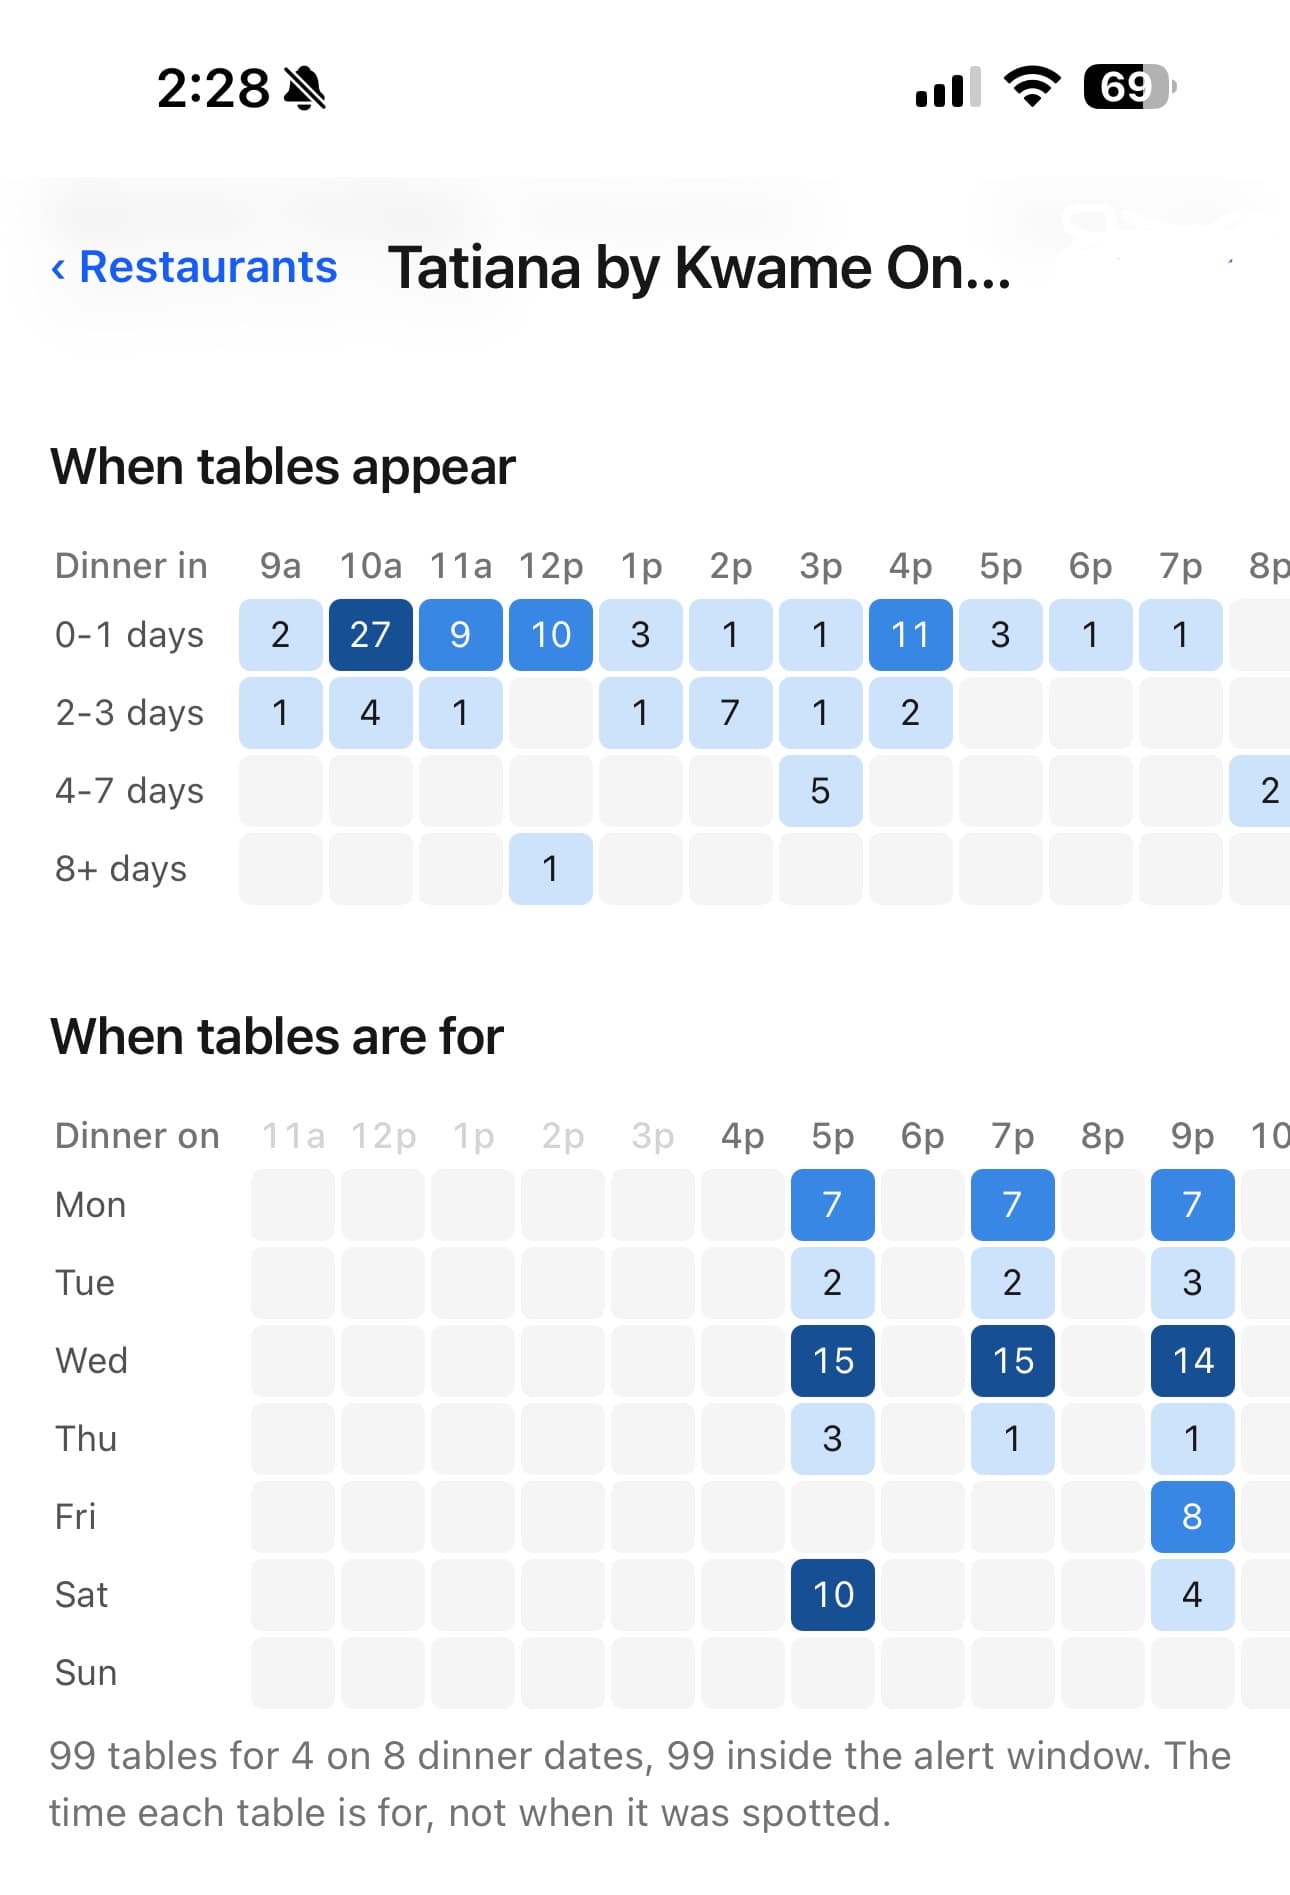
Arrival rate is wanted tables appearing per hour for one night, kept per restaurant, by how far out the night is (0 to 1, 2 to 3, 4 to 7, 8 or more days) and by hour of day. A table found by a check that came T minutes after the previous one stands for more than one table, scaled by the share a check every T minutes would see, so slow checks do not undercount.
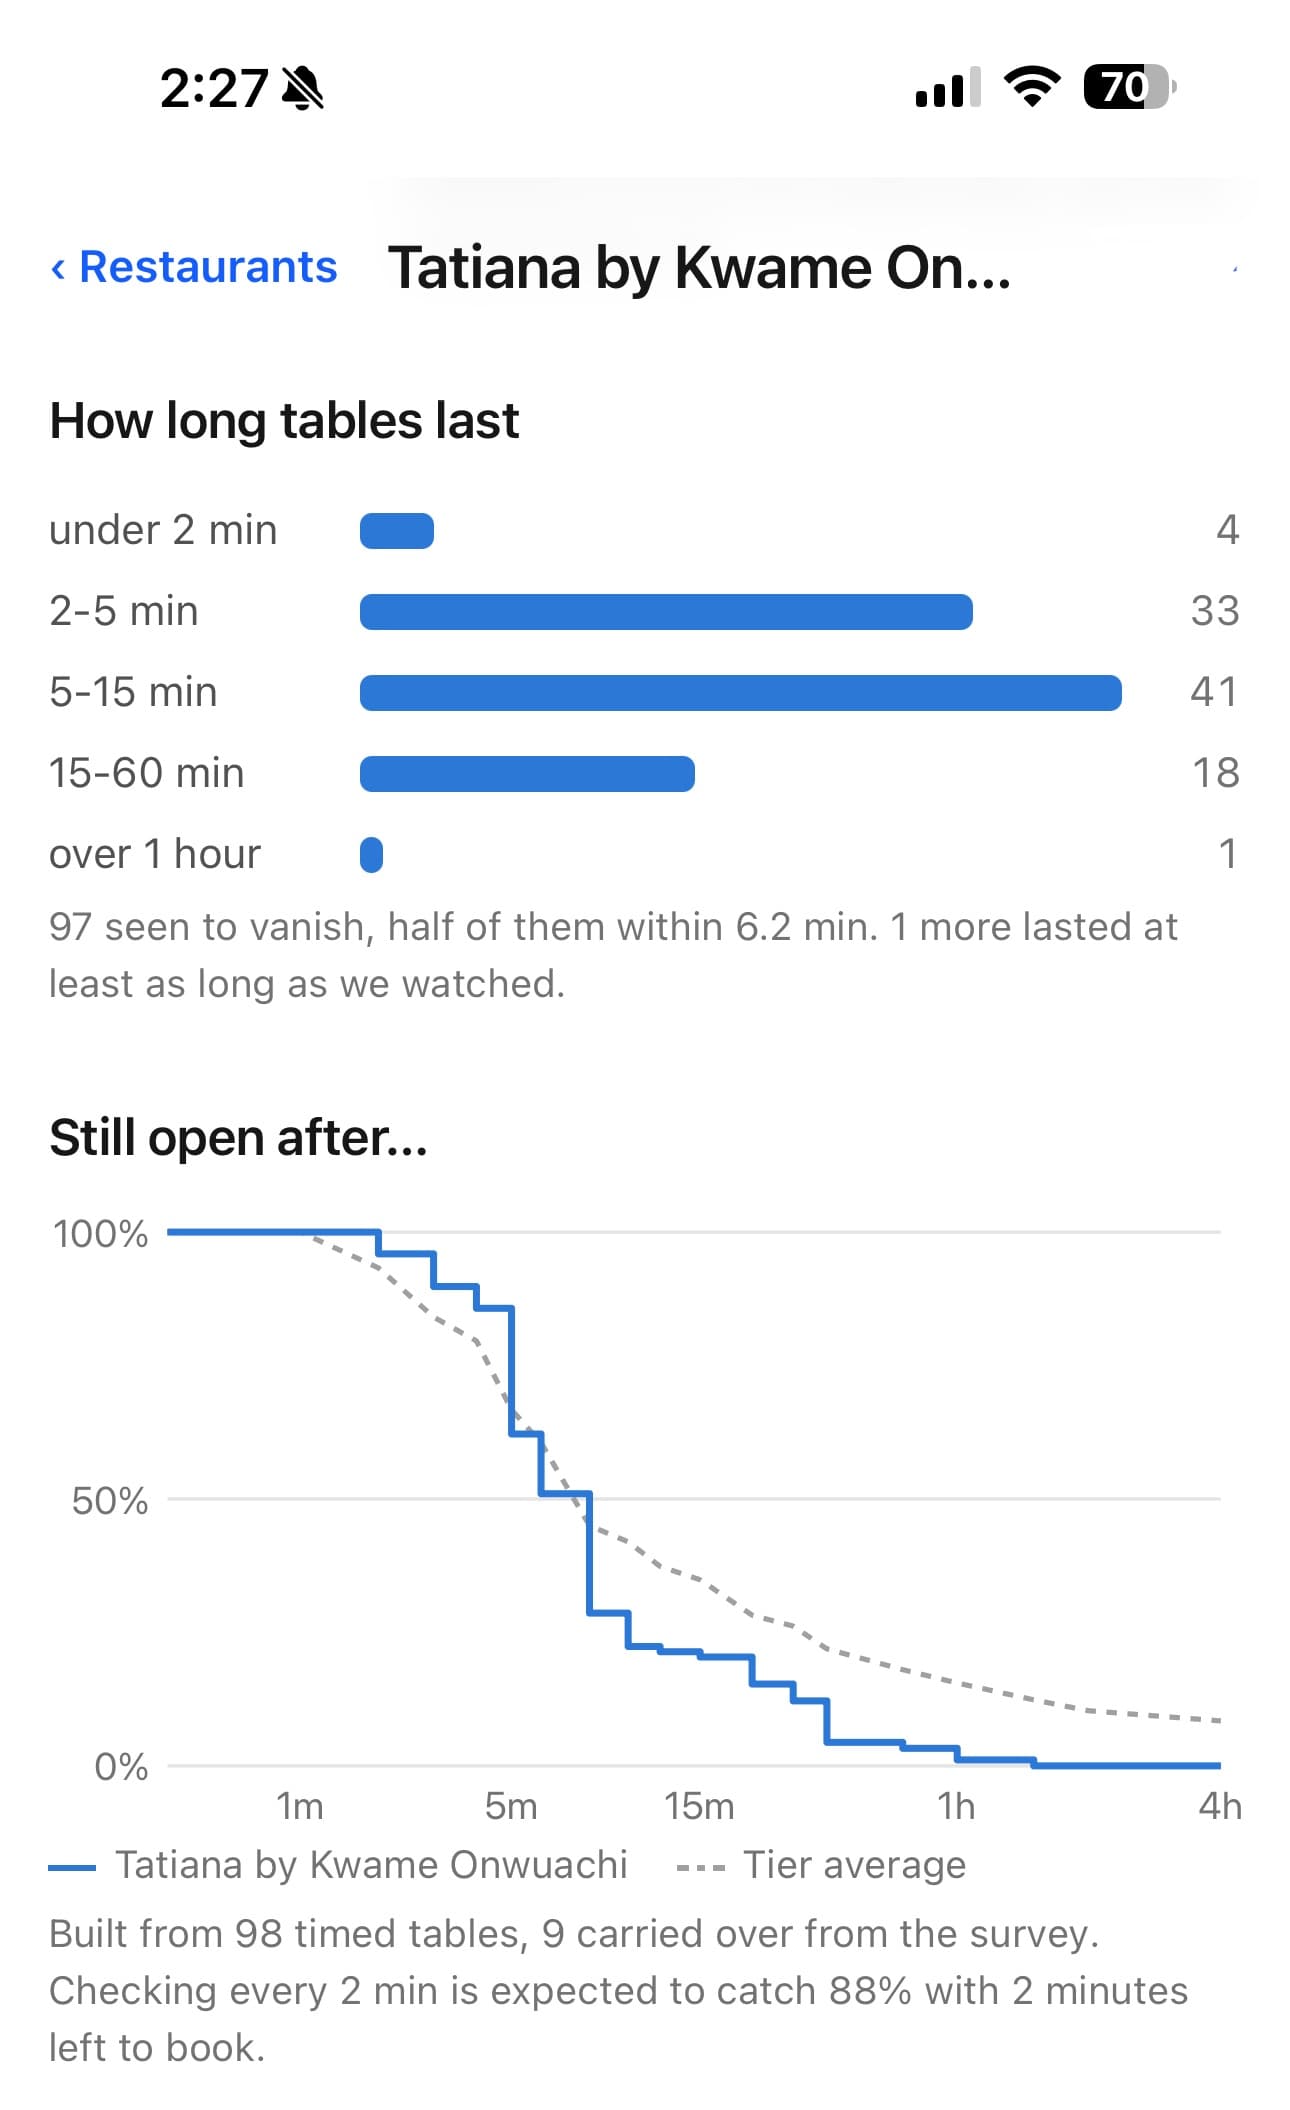
Lifetime is a survival curve: from every table timed from its start, a Kaplan-Meier estimate of the share still open after t minutes, with tables that were still open when the night passed counted as lasting at least that long. The catch rate of checking every T minutes is the average of that curve over one interval, shifted by the minute or two it takes me to tap the link.
A restaurant with few timed tables does not get its own curve yet. Its group's pooled curve stands in, and the restaurant's own curve takes over by n divided by n plus a constant as tables accumulate. Thin arrival-rate cells lean on the restaurant's overall rate the same way, and that on the group's.
The survey
Before any algorithm, weeks of watching at very high fidelity to learn what actually happens at each place.
The first pass was a wide scan of 44 restaurants: the month calendar, then the full set of times for every night that showed a table, several times a day. Whenever anything new appeared, that restaurant and night was re-read every two minutes until the table was gone, so each opening got a measured lifetime. A few restaurants got a close watch of their own, because a night that already shows a late bar seat looks the same on the calendar when a 7:30 table appears inside it.
Every read landed append-only, so every chart since has been rebuilt from the same rows. What it established: restaurants fall into three kinds for a party of four (nothing ever, tables but rarely at prime time, easy), the calendar is a cheap tripwire for sold-out places and blind for the rest, table type matters as much as time, and most openings last minutes rather than hours.
The algorithm
A fixed budget of checks, spent each hour where it buys the most tables I could actually book.
Every target is one restaurant's calendar or one night, and its value is weight times nearness times arrival rate times the catch rate at its interval. Nearness is 1 for the calendar and nights up to two days out, then halves and halves again. Every target starts at a check an hour. The allocator takes the one step down the ladder that buys the most expected bookable tables per added check, and repeats until the hour's budget is spent. The gain of the last step taken, g*, is the pressure on the budget, and a simple rule that shares the budget by weight and nearness is computed beside it every hour.
It ran in shadow first, logged next to what the watcher actually did, and a restaurant only graduates from close watching to the allocator once it has enough timed tables across enough days, a tight catch estimate, and a curve that predicts its newest two days.